
The trading time frame is crucial because it determines the period over which you make investment decisions. Short-term traders focus on exploiting daily or intra day price movements, while long-term investors navigate broader market trends. Your chosen time frame significantly impacts risk management, strategy development, and the overall success of your trading approach.
Most people who see charts for the first time use the 1-day time frame of prices and are unaware of the fact that many other time frames exist! When a person sees a day’s price chart, they see 1 candle that has the Open, High, Low, and Close (OHLC) prices of that security.
However, a typical Indian trading day has 6 hours and 15 minutes of trading time. That means that there are 375 minutes [(6 x 60) + 15] OR 22,500 seconds in every trading day!
Here’s where it gets interesting. Many people make money simply by profiting off the price changes that occur every minute/second!! This is where the concept of “time frames” comes in.
What Are Time Frames In Trading?
A time frame refers to how much time a single candle denotes. If you set the settings to 1 day, you can see the changes in the price of a financial asset on a daily basis. If the same is at 1 minute, you will notice the changes in price occurring in the asset every minute!
Depending on the settings of the charting tool one uses, one can monitor the price changes happening every second or changes occurring throughout a year in a single candle! Moreover, the concept of time frames is not limited to candlestick charts or stocks. The prices of any financial security can be monitored in multiple time frames in multiple types of charts!
Why Does Your Trading Time Frame Matter?
The trading time frame is important since it impacts decision-making and establishes the length of your investing horizon. While long-term investors follow market patterns over months or years, short-term traders concentrate on intra day or daily changes and profit from volatility.
Selecting the appropriate time period is in line with each person's trading style, financial objectives, and risk tolerance. It influences the relevance of market swings as well as the analysis methods that are employed. To put it simply, the trading time frame is a key component in creating a precise and successful trading strategy.
Time Frames are something you need to think about for a number of reasons. Here they are, as promised!
- Comprehensive Analysis: By analyzing various time frames, traders can gain a more comprehensive understanding of a stock's overall market dynamics. This includes short-term trends, medium-term swings, and long-term investment perspectives.
- Confirmation of Trends: Analyzing multiple time frames can confirm trends. For example, if a short-term uptrend aligns with a medium-term and long-term uptrend, it adds conviction to the strength of that particular trend.
- Improved Entry and Exit Points: Multiple time frames help traders identify optimal entry and exit points. For instance, a short-term trader might use intra day charts to fine-tune entries and exits, while confirming these decisions with higher time frames for a broader perspective.
- Risk Management: Incorporating different time frames aids in more effective risk management. Traders can set tighter stop-loss levels based on short-term trends while allowing for wider fluctuations when considering long-term trends.
- Adaptability to Market Conditions: Markets can exhibit different behaviors on various time frames. Traders who use multiple time frames are better equipped to adapt to changing market conditions, shifting their strategies as needed.
- Avoiding False Signals: Analyzing multiple time frames helps filter out false signals that may be prevalent on shorter time frames. Confirmation from higher time frames can reduce the likelihood of being misled by short-term market noise.
- Understanding Market Sentiment: Multiple time frames offer insights into market sentiment at different levels. Short-term sentiment may differ from longer-term sentiment, and understanding these nuances can be valuable for decision-making.
How Are They Used?
Using time frames depends entirely on personal preference. If you are someone who has chosen to make a living as a trader, you would normally use the 1-minute or 5-minute time frames, which will help you identify opportunities for profit in smaller durations and give you returns almost every day!
However, if you are an employed professional who simply invests and forgets, then a longer time frame like 1-day or 1-week will be something you use to ignore small movements and achieve your desired returns. In some extreme cases, some pro-traders may use 1-second charts to scalp the smallest gains while some very long-term investors may use 6-month or 1-year time frames to see the overall trend!!
There is a very common saying in the field of Technical Analysis: Trend is your Friend.
Whether it's an uptrend (denoted by higher highs and higher lows) or a downtrend (denoted by lower highs and lower lows), multiple time frames can help you confirm these trends and benefit from the movement. So, the confirmation received from a smaller/broader time frame can help confirm/deny an analysis.
However, multiple time frames can also be misleading without accurate assessment. Let’s take the example of Vedanta Ltd. The image shown below is the 1-minute chart of the mining giant.
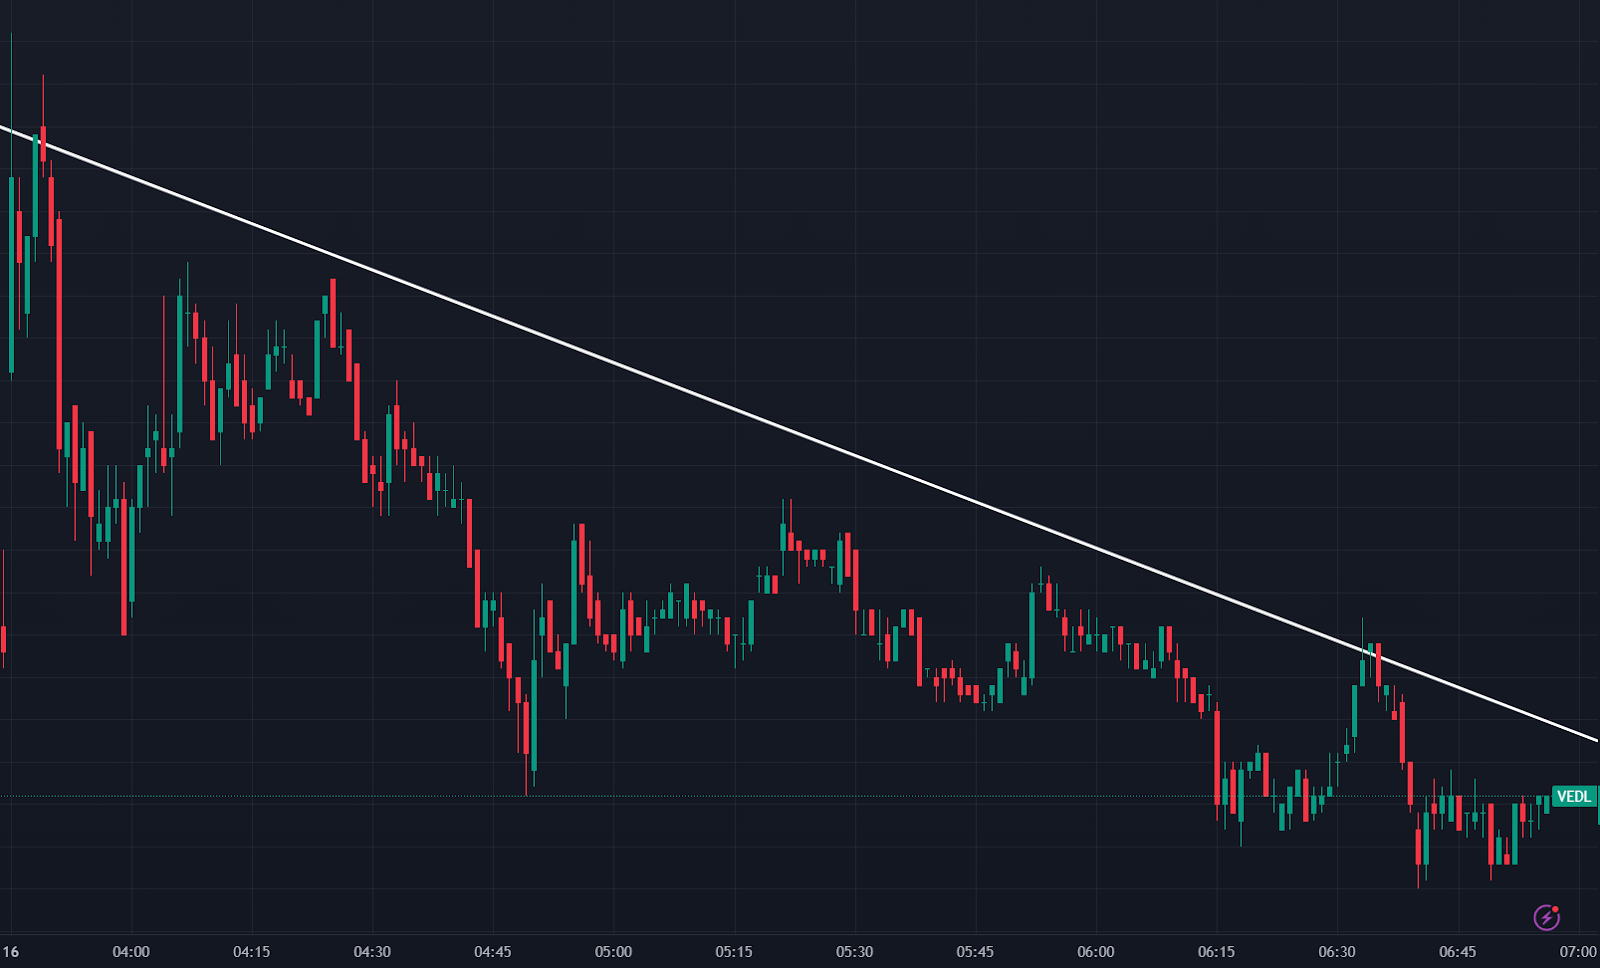
The consistently lower highs and lower lows are a classic indicator of a downtrend. A downtrend signals a price reversal which will result in a significant decline in the price of the asset, resulting in a loss to investors who bought at higher prices while being a profitable scenario for short sellers. However, the daily time frame, which is larger, shows a different scene.
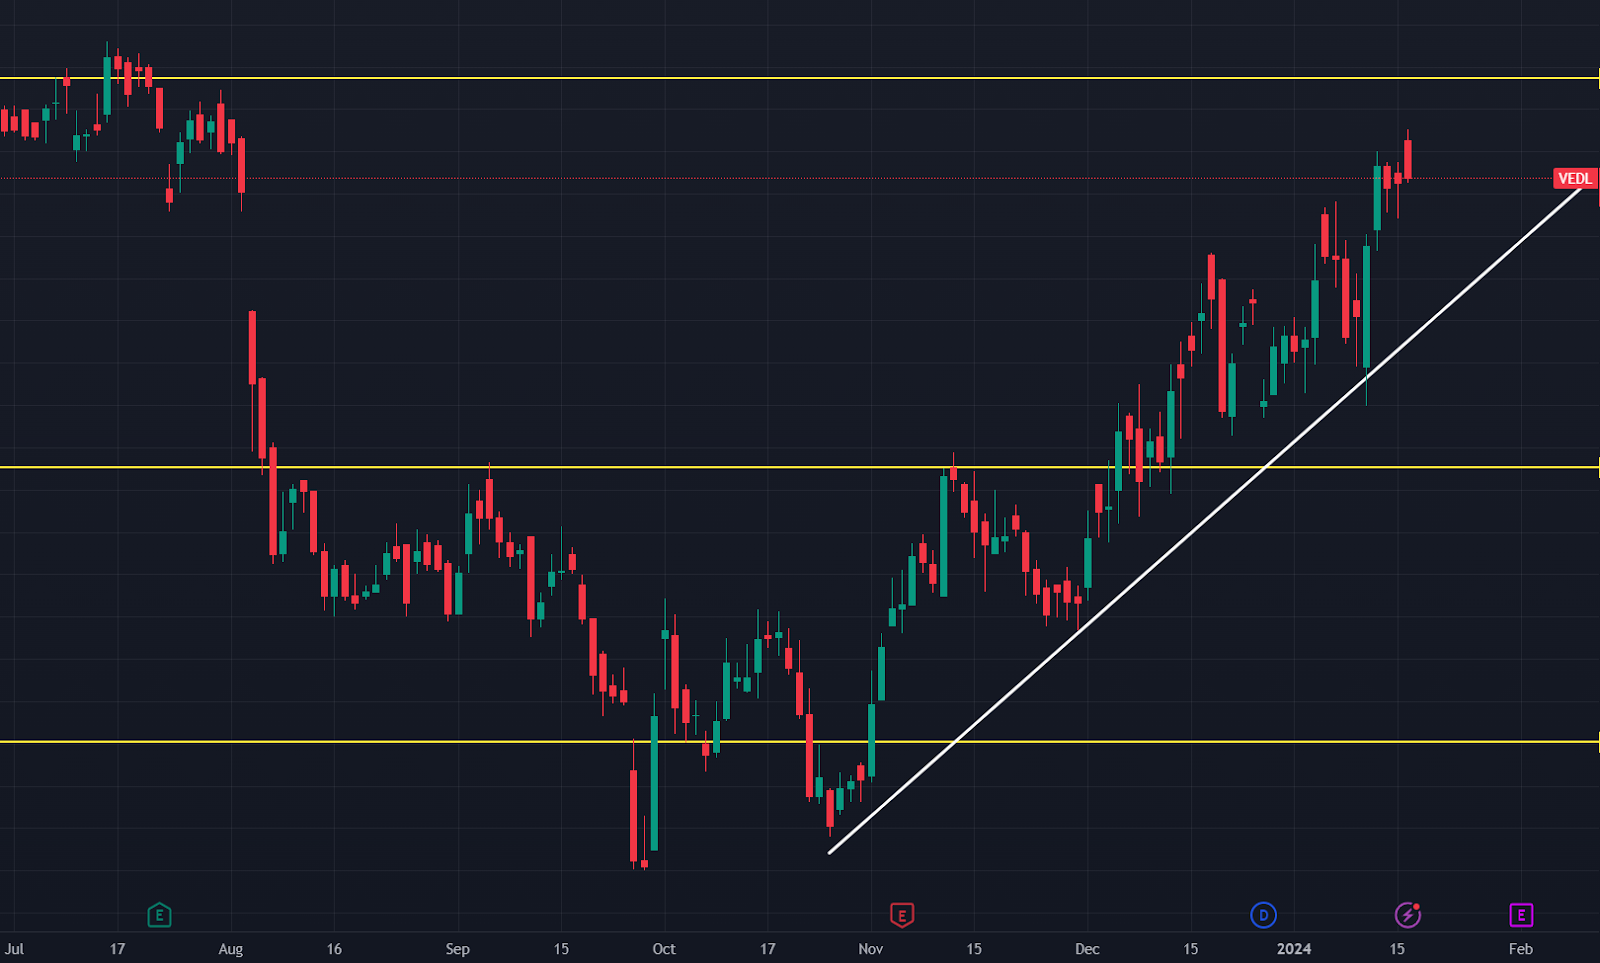
This daily time frame shows an uptrend! The stock had declined around August and was falling until November 2023 after which buyers began buying once again, driving the stock price up. The 1-minute time frame was showing a day when sellers were active but was not necessarily an indicator of a broader downtrend.
In fact, market trends showed that despite selling pressures, buyers continued to push higher and were reaching the latest resistance level despite persisting selling pressures. Any non-intra day short selling attempt would thus end up causing loss to traders!
Thus, by misinterpreting these signals and over-analyzing charts, some newbie traders end up burning their account. Therefore, time frames are important tools but one needs practice to identify these trends correctly and gain from them.
Popular Time Frames: -
- 1 minute
- 5 minutes
- 15 minutes
- 30 minutes
- 1 hour
- 3 hours
- 1 day
- 1 week
- 1 month
- 3 months
However, the above list is not exhaustive. There are several other time frames used by traders that can range from 1 second to 1 year!
Drawbacks of Time Frames
- Conflicting Signals: Different time frames may generate conflicting signals, making it challenging to establish a clear and consistent trading or investment strategy. A short-term trend might indicate one direction, while a long-term trend suggests another, creating uncertainty.
- Increased Complexity: Analyzing multiple time frames adds complexity to decision-making. Traders may find it challenging to synthesize information from various charts and time perspectives, potentially leading to confusion and indecision.
- Over-Optimization: Traders might be tempted to over-optimize their strategies by fine-tuning them based on different time frames. This can result in strategies that work well historically but may fail to perform in changing market conditions.
- Time-Consuming: Analyzing multiple time frames requires time and effort. Traders may find it time-consuming to assess charts at different intervals, potentially leading to analysis paralysis or missed trading opportunities.
- Not Suitable for All Traders: Multiple time frames may not be suitable for all traders. Some may find success in focusing on a specific time frame that aligns with their trading style, expertise, and risk tolerance.
FAQs
1. How does the choice of time frame affect trading strategies?
The choice of time frame greatly influences trading strategies. Short-term traders may use technical analysis for quick profits, while long-term investors often rely on fundamental analysis to assess a company's value over time. Different time frames require different approaches to risk management and decision-making.
2. How do macroeconomic factors impact stock time frames?
Macroeconomic factors, such as interest rates, economic growth, and inflation, can affect stock time frames. Short-term traders may react to immediate economic news, while long-term investors consider broader economic trends influencing a company's performance over time.
3. How can investors choose the right time frame for their goals?
Investors should align their choice of time frame with their financial goals, risk tolerance, and time commitment. Short-term trading requires more active monitoring, while long-term investing allows for a more hands-off approach. Matching the time frame to personal preferences and objectives is crucial.
4. How does the concept of risk-reward ratio apply to different stock time frames?
The risk-reward ratio is a crucial consideration in all stock time frames. Short-term traders often aim for higher risk-reward ratios for each trade, accepting a higher level of risk for the potential of quick profits. Long-term investors typically have a more conservative risk-reward approach, focusing on the overall growth potential of their investments while accepting lower short-term volatility.
5. Can market liquidity affect different stock time frames?
Yes, market liquidity can impact different stock time frames. Short-term traders often prefer stocks with high liquidity to ensure they can easily enter and exit positions without significant price slippage. Long-term investors may have more flexibility in dealing with less liquid stocks, as they are not as concerned with immediate buy or sell transactions.
6. What are the main factors to consider when choosing a time frame?
Individual preferences, risk tolerance levels, and time commitment are the most important factors. For example- an individual who doesn’t have the time to constantly monitor his investments and has a poor risk appetite will choose a longer time frame while another individual with a do-or-die attitude who wants quick money would choose a shorter time frame.


 1,499
1,499