
In Technical Analysis, Support and Resistance are two fundamental ideas. It is important to understand the meaning of these terms and their practical implications in order to accurately interpret pricing charts.
The dynamics of supply and demand determine prices. Prices increase when supply cannot keep up with demand. Prices decrease as supply outpaces demand. Prices will occasionally float sideways when supply and demand are balanced.
Technical principles are generally simple to explain and rationalize, but mastering their application frequently requires years of effort, much like many other concepts in technical analysis.
A Target Price and Stop-Loss are extremely important prices that are essential for a trader. His decisions are based on these two prices. Is there something that can indicate the buying and selling levels for a stock in the entire stock market? Yes.
These are some of the most important price points that any trader will find on a price chart and the importance of these price points is immense since these are some of the fundamental concepts of technical analysis.
What is Support?
‘Support’ is the price level of the stock at which the trader anticipates maximum demand. The stock price is falling due to selling pressure from Bears and buyers are waiting for a certain price level wherein they can enter specific positions to generate returns. Since the price keeps falling, the buyers keep waiting for a lower price to maximize their profits. With every price decline, more buyers wish to enter the trade.
As such, the ‘Support’ is the price level at which the demand for the stock is expected to be the highest. Buyers rush to buy the stock as the price stops declining and the excess supply, which was causing the price decline, gets absorbed by the enthusiastic buyers who want to buy the stock at the lower price. The price of the stock stops declining at this point and resumes going upwards.
What is Resistance?
‘Resistance’, is the price level where the supply of the stock is expected to be maximum. The prices have been climbing as buyers have continued buying. However, as the stock price reaches the resistance level, the buying slows down either because the buyers have already achieved their targets or because they feel the valuation of the company is too high. By the time the stock reaches the resistance level, it does not have much demand to drive up the price as the stock stops going upwards.
‘Support’ & ‘Resistance’ are often considered triggers to buy or sell a particular stock as they signify a movement in the other direction.
But is it a rule that Support and Resistance are always respected? No.
Let’s Understand The Concept of Support and Resistance Through an Example.
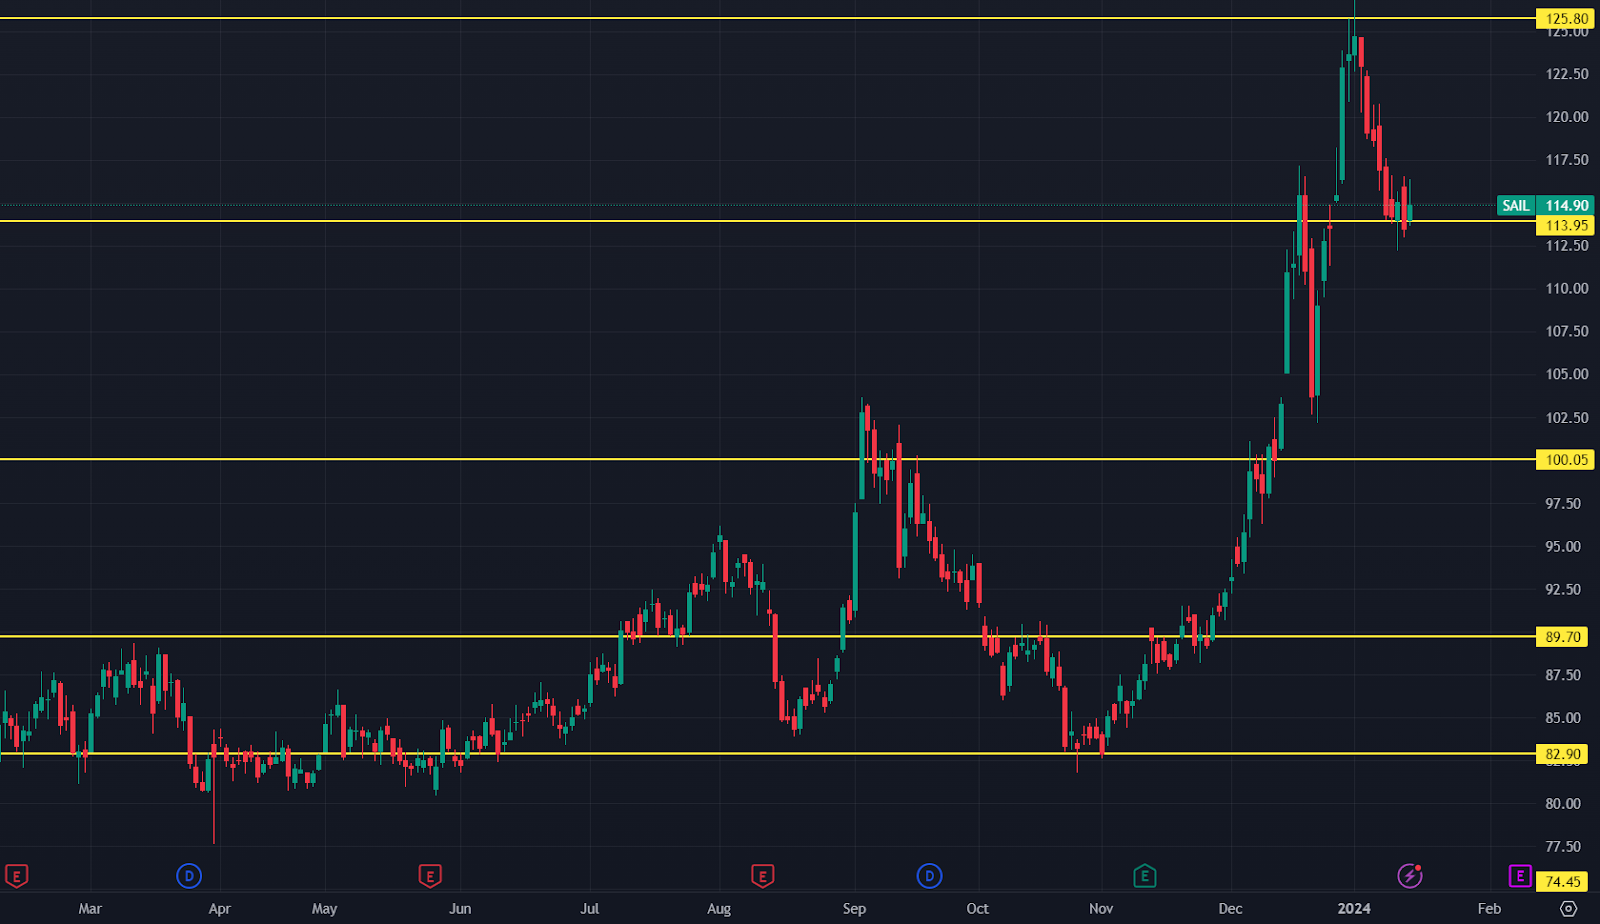
Shown above is the candlestick chart of the Steel Authority of India (SAIL), India’s largest steel-producing PSU. As seen above, the yellow lines mark the relevant Support and Resistance levels.
As seen above, these lines are the relevant Support and Resistance levels where the price has reversed or consolidated around before breaching. If you observe closely, the price of the stock has respected its lowest support at Rs 82.90 and has reversed from those levels. Similarly, other levels observed above were plotted after carefully studying historical trends.
The most important thing to note here is that the stock consolidated around the resistance at Rs 100.05. However, after consolidating for a few sessions, it broke through the level to reach new highs. So, market conditions can render these levels moot.
The key to placing accurate support and resistance lines is to recognize significant swings. The point where the price of the stock has reversed or faces rejection is a point where the market sentiment has changed and therefore is a point that could be a support or resistance. If the price is currently above such a level, it becomes a Support & if it is below such a level, it is a Resistance.
Interestingly, once a price breaches either level, the roles are reversed. So, if the price breaks through a Support, said support level becomes a Resistance!
Trendlines: -
As shown in the above example, the Support and Resistance levels are lines that can help monitor where prices will move after reaching a certain level. However, these lines are static and do not consider any movement in the trend. If a stock price keeps moving up, it will form a pattern, and such a pattern can identified using a trendline.
A trendline helps understand the prevailing trend in the market with a diagonal line marking the bottoms (in case of an uptrend) or tops (in case of a downtrend) of the candles. Let’s understand trendlines with the help of the following example.
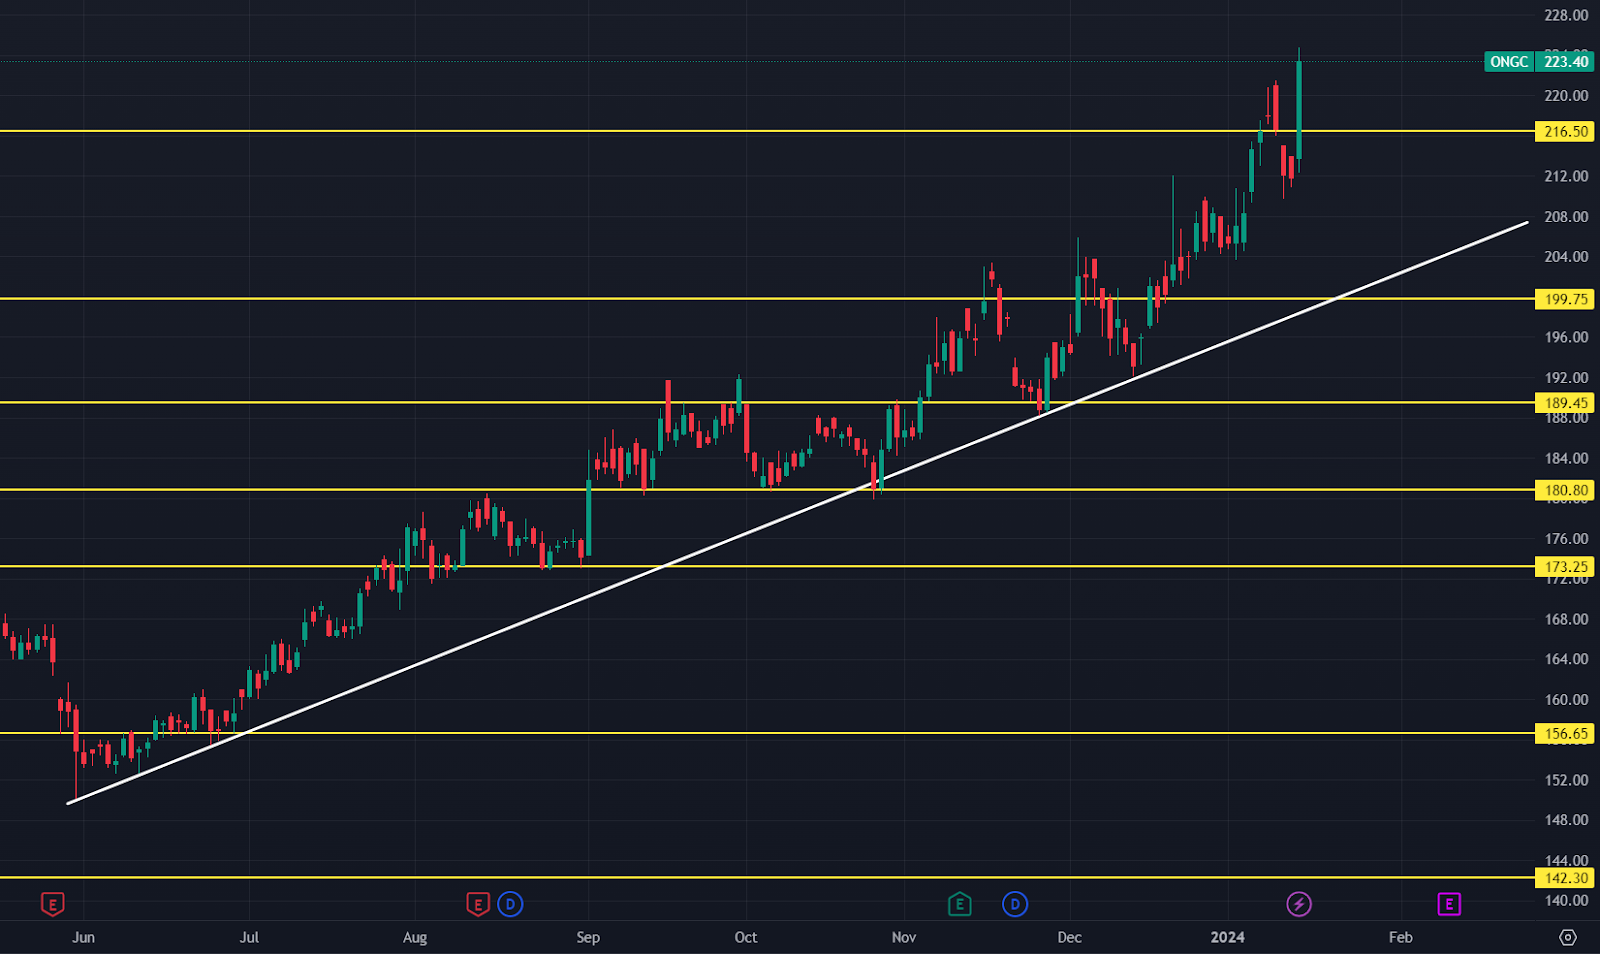
Shown above is the daily candlestick chart of ONGC. As shown above, the support and resistance levels (marked in yellow) support the prices, but the broader move in the market is supported by the white line, which is the trendline here. What happens is that as the price moves upwards, the price dips due to factors like profit booking. However, the price doesn’t fall all the way to the immediate support.
It dips a little and resumes climbing. So, a trendline helps investors identify the direction of the share. If the share breaches the trendline and sustains such a breach over multiple sessions, it could signal a trend reversal.
Benefits: -
- Helps identify credible entry and exit points.
- Provides valuable intel about the overall market trend.
- Reflects the collective actions of all market participants.
- Helps make better trading decisions.
Limitations: -
- Not always accurate
- Difficult to find the right one.
- Too precise.
- Very rigid, could result in misleading signals.
Also Know : Why did we ever really need technical analysis?
FAQs
1. Can support and resistance levels be applied to different timeframes?
- Yes, traders often use them on various timeframes, from short-term intraday charts to longer-term daily or weekly charts.
2. Do support and resistance levels work in all market conditions?
- While they are widely used, their effectiveness can vary. In strong trending markets, traditional support and resistance levels might not hold as well.
3. What is a breakout and breakdown in relation to support and resistance?
- Breakout: When the price moves above a resistance level.
- Breakdown: When the price moves below a support level.
4. Can support become resistance and vice versa?
- Yes, after a breakout, a previous support level can become a resistance level, and vice versa.
5. Do support and resistance levels always hold?
- No, they are not foolproof. Market conditions and trends can change, leading to breakthroughs or breakdowns of these levels.


 1,499
1,499