
Indicators are statistical tools that are used to anticipate financial or economic trends, as well as to monitor existing situations.
What Is An Indicator?
Indicators serve as statistical tools employed to assess current circumstances and predict financial or economic trajectories. Within the realm of investing, indicators typically encompass technical chart patterns derived from a security's price, volume, or open interest.
Examples of common technical indicators include moving averages, MACD (moving average convergence divergence), RSI (relative strength index), and OBV (on-balance-volume).
Economic indicators, on the other hand, are statistical metrics utilized to gauge the expansion or contraction of the overall economy or specific sectors within it. This category encompasses data points like the Consumer Price Index (CPI), Gross Domestic Product (GDP), and unemployment figures.
In the context of technical analysis, an indicator manifests as a mathematical calculation based on a security's price or volume. The outcomes of these calculations are then applied to predict future price movements.
Beyond finance, key performance indicators (KPIs) constitute quantifiable measurements employed to evaluate a company's success relative to specific targets or objectives. Indicators of a company's profitability commonly include metrics such as gross margin, operating margin, net margin, and return on equity (ROE).
Benefits of Indicator
Indicators in the stock market act as powerful spotlights, illuminating valuable insights that might otherwise remain hidden in the price data's dense jungle. Their benefits are multifaceted: they help identify trends, gauge momentum, pinpoint potential entry and exit points, and even assess risk.
By analyzing price, volume, and other data through various formulas, indicators translate complex information into clear visuals, aiding traders in making informed decisions.
Indicators enhance strategic decision-making by offering objective signals alongside a broader understanding of market sentiment. So, while they can't guarantee riches, wielding these analytical tools effectively can significantly improve a trader's navigation through the dynamic landscape of the stock market.
Types of Indicators-
- Leading Indicators
Leading indicators, often seen as inputs, guide actions necessary for achieving measurable outcomes and driving overall business objectives. They prompt stakeholders to ask questions like improving processes, enhancing team skills, and expediting product development.
By offering benchmarks, leading indicators indicate progress toward key performance indicators (KPIs) and overarching goals. Examples for an enterprise software company could include the percentage of customers signing up for two-year agreements, the number renewing at mid-term, and those purchasing software add-ons.
- Lagging Indicator
A lagging indicator measures current production and performance, contrasting with the dynamic yet challenging-to-measure nature of leading indicators. While leading indicators guide actions for desired results, lagging indicators, often compared to output metrics, answer questions like event attendance, product production, and response.
They assess past output, offering insights for future success by measuring metrics such as profit, expenses, customer participation, renewal rates, and revenue.
Popular Indicators-
-
Moving Averages
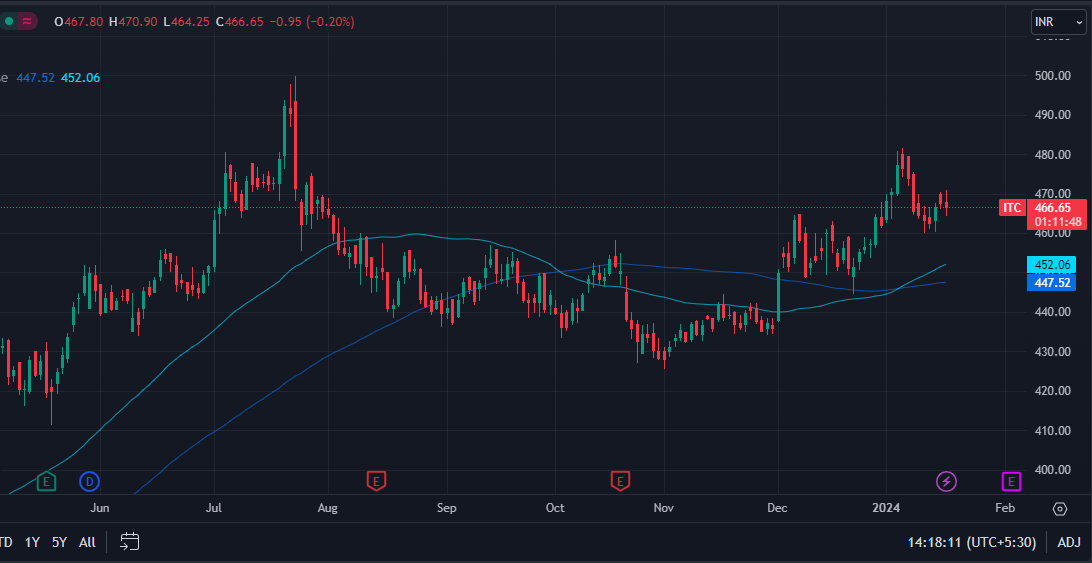
Moving averages smooth out price data to create trend indicators. These averages can be calculated over various periods, such as 10 days or 200 days. Traders analyze the angle of the moving average; a horizontal movement suggests price ranging, while an upward angle indicates an uptrend.
Moving averages don't predict future stock values but reveal price trends over time. Crossovers, like the 50-day moving average rising above the 200-day, signal a buy, and vice versa for sell signals.
-
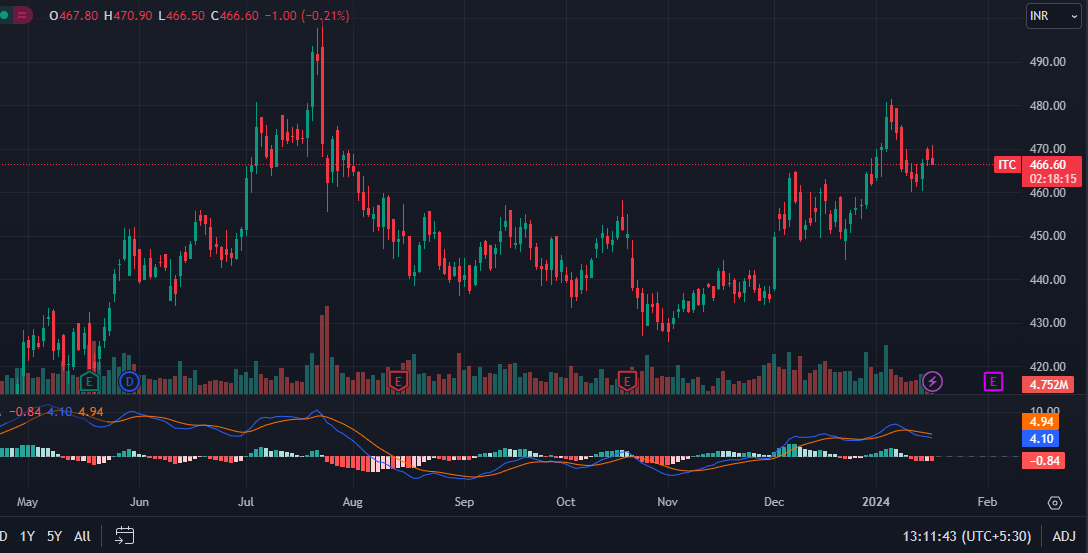
Moving Average Convergence Divergence (MACD)
MACD is a momentum indicator in the stock market, revealing the relationship between two moving averages (26 EMA and 12 EMA). It consists of the MACD line (difference between the two) and the signal line (9 EMA). A buy signal occurs when the MACD line crosses the signal line from below, and a sell signal occurs when the MACD line crosses from above.
-
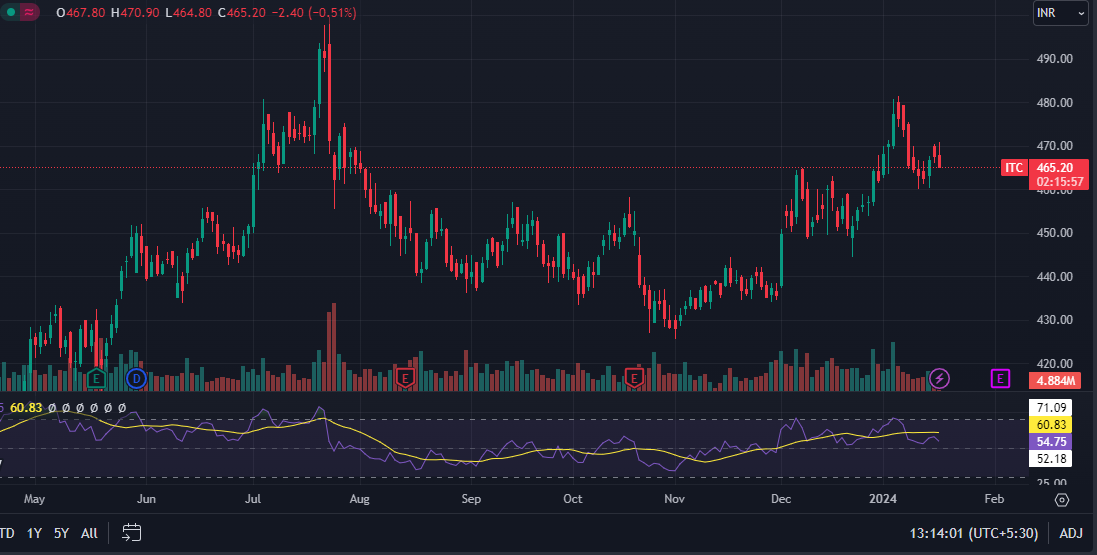
Relative Strength Index
Relative Strength Index (RSI) is a widely-used momentum indicator oscillating between zero and 100. Traders spot signals through divergences and crossings of the centerline at 50. Crossing above 50 signals positive momentum, but hitting 70 or above indicates overbought conditions.
-
On-Balance Indicator
On-Balance Volume (OBV) is a volume indicator assessing buying and selling pressure by summing up volume on up days and subtracting it on down days. It emphasizes the direction of volume, considering up-volume when the stock closes higher and down-volume when it closes lower than the previous day.
-
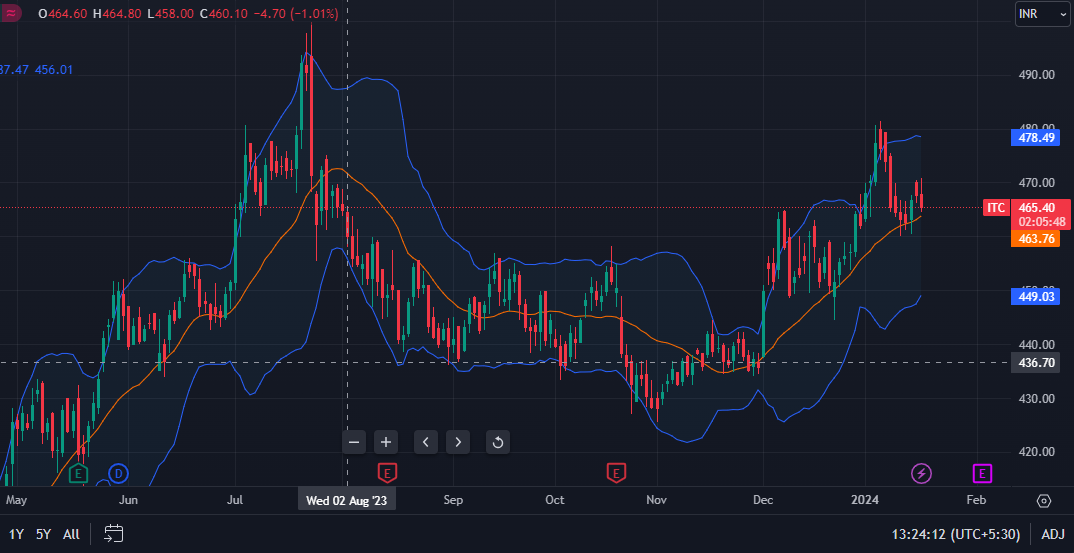
Bollinger Bands
Bollinger Bands, comprising upper, lower, and middle bands, use a 20-day moving average as the middle band, +2 Standard Deviation for the upper band, and -2 Standard Deviation for the lower band. Market volatility expands the bands, while decreased volatility contracts them. Traders utilize Bollinger Bands by entering trades when prices break out from either side after a low volatility or consolidation phase.
Limitation of Indicator-
Investors and traders should be mindful of various limitations associated with stock market indicators. One significant limitation is found in lagging indicators, as many of them rely on past price movements and trends. This characteristic poses a challenge, as these indicators may not provide accurate predictions for future market movements.
Frequently Asked Questions:
1. What Is a Common Indicator of a Phishing Attempt?
Signs of a phishing attempt include emails that are unsolicited, contain numerous typos, insist on urgent action, and request unusual tasks from you.
2. What Is a Key Performance Indicator?
A key performance indicator (KPI) is a measurable metric employed to gauge a company's success in achieving a specific target or objective. Common KPIs encompass net profit, sales, and customer retention rate.
3. What Is an RSI Indicator?
The relative strength index (RSI) is a technical analysis indicator that assesses the magnitude of recent gains in comparison to recent losses. It is utilized to gauge the price momentum of an asset, indicating whether it is moving upward or downward.
4. What is the use of an indicator?
Indicators are statistics used to measure current conditions as well as to forecast financial or economic trends. In the world of investing, indicators typically refer to technical chart patterns deriving from the price, volume, or open interest of a given security.
Also Read: Understanding Support, Resistance


 1,499
1,499