The Italian mathematician Leonardo Pisano Bigollo (better known by his pen name Leonardo Fibonacci) is the inspiration for the name of the Fibonacci retracement levels. He introduced the unique sequence of numbers he studied in Hindu-Arabic numerals and observed in sunflower heads & snail shells as the Fibonacci Sequence in his book called Liber Abaci.
What Are Fibonacci Retracement Levels?
Considering its existence in nature and practicality, the Fibonacci Sequence has become a technical analysis tool used to identify potential support and resistance areas on a price chart. Traders and analysts use these levels to predict potential areas where an asset's price might change directions during a trend.
How are Fibonacci Retracement Levels Calculated?
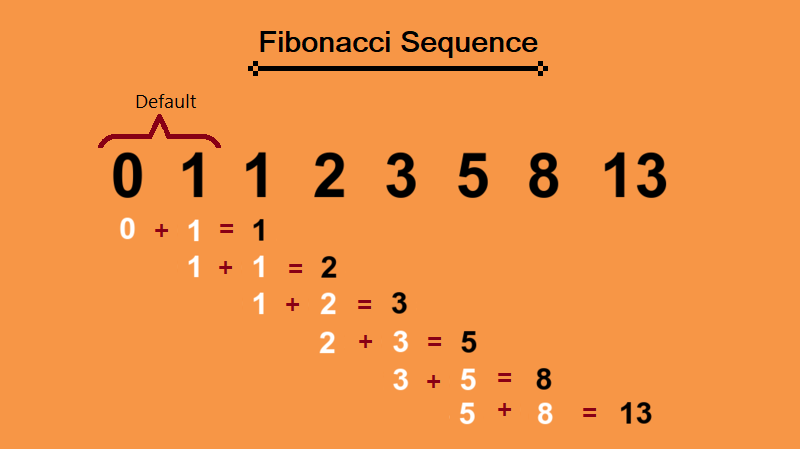
The following is the Fibonacci sequence:
0, 1, 1, 2, 3, 5, 8, 13, 21, 34, 55, 89, 144, 233, 377, 610 …
As you can see, the first number is added to the second to give the third number in the sequence, the second and third are added to give the fourth, the third and fourth to give the fifth, and so on.
This Series has a few intriguing characteristics: -
1] Any number in the series can be divided by the one before it, and the resulting ratio is always roughly 1.618.
610/377 = 1.618
377/233 = 1.618
233/144 = 1.618.
The Phi, also called the Golden Ratio, is 1.618.
2] When a number in the Fibonacci series is divided by its immediately subsequent number, one can observe astonishing consistency.
89/144 = 0.618
144/233 = 0.618
377/610 = 0.618.
Remember that 0.618 is 61.8% when presented as a percentage at this point.
3] Any number in the Fibonacci series can be divided by a number two places higher and yet exhibit the same consistency.
13/34 = 0.382
21/55 = 0.382
34/89 = 0.382
When stated as a percentage, 0.382 equals 38.2%.
4] Consistency also occurs when a Fibonacci number is split by a number that is three places higher.
13/55 = 0.236
21/89 = 0.236
34/144 = 0.236
In percentage numbers, 0.236 is equal to 23.6%.
How to Apply Fibonacci Retracement Levels: -
- Select the High and Low Points: Identify a recent significant swing high and swing low on the price chart. These points should represent a notable trend or price move.
- Apply Fibonacci Ratios: Once the high and low points are identified, the Fibonacci retracement levels are drawn by applying the Fibonacci ratios to this price range. The levels used are 0, 23.6%, 38.2%, 50%, 78.6%, and 100%.
- Calculate the Levels: The levels are calculated by measuring the percentage retracement from the high to the low points in a particular trend.
For example, Let’s say the high and low of a trend are Rs 1,500 and Rs 1,000. So, the 23.6% level would be: 1500 - [(1500-1000) x 0.236] = Rs 1,382.
Similarly, the 61.8% level would be: 1500 - [(1500-1000) x 0.618] = Rs 1,191.
- Plotting the Levels: These calculated levels are plotted on the price chart as horizontal lines. Traders and analysts use these lines to identify potential areas of support or resistance where price action might react.
How to Use Fibonacci Retracement Levels: -
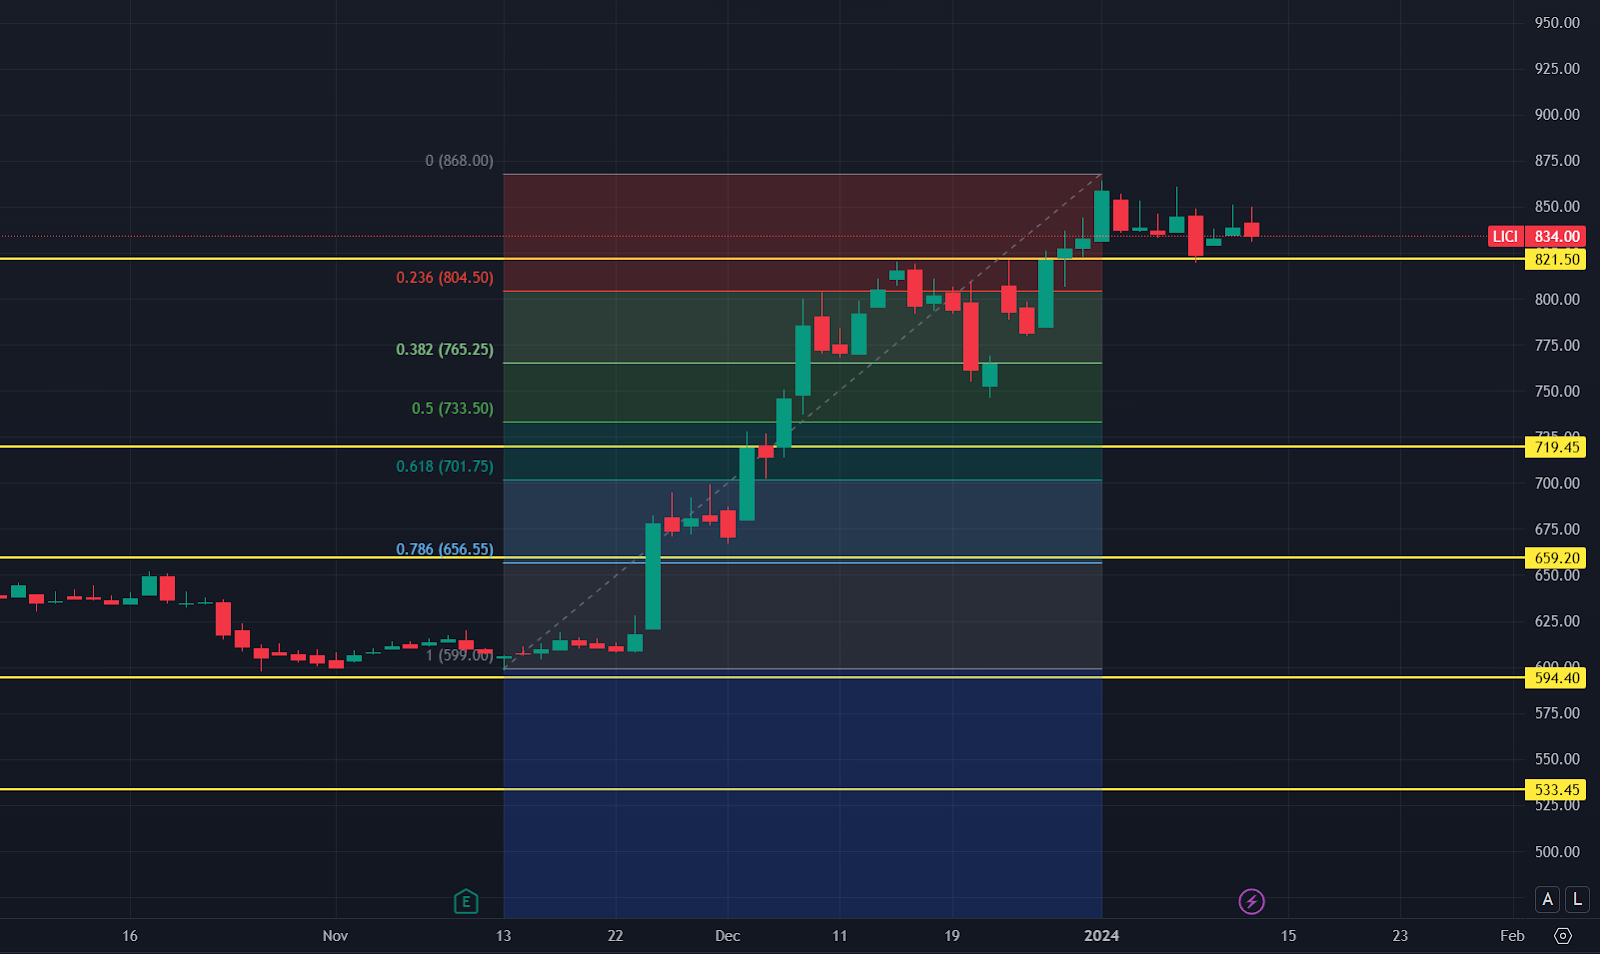
The chart shown above is that of the Life Insurance Corporation (LIC) of India. The Fibonacci Retracement levels have been plotted on the candlesticks and we can see multiple levels automatically placed in the range we selected.
In the uptrend, we see that the price, which has resisted the highest level is consolidating. What Fibonacci Retracement says is that if the price faces sharp rejection from there, it would find support at the 23.6% level.
Similarly, in a downtrend, if the price reverses from its lowest level in the trend, the price would face resistance at the closest Fib retracement level.
Benefits of Using Fibonacci Retracement Levels
- With the correct settings, these levels can properly determine reversals and changes in trends.
- These are based on mathematical calculations and not historic price trends.
- The tool can be used on any asset in any timeframe, making it versatile.
Limitations of Using Fibonacci Retracement Levels
- Subjectivity and Interpretation:
Determining the exact swing highs and lows to apply Fibonacci retracement levels can be subjective. Different traders might select slightly different points, leading to variations in identified levels.
- Not Always Reliable in Isolation:
Relying solely on Fibonacci retracement levels without considering other technical indicators or fundamental analysis can be risky. Markets don't always conform to these levels, and using them in isolation might result in incorrect trading decisions.
- Lack of Universal Applicability:
These levels might work well in certain market conditions but might be less effective in others. Market volatility, sudden news events, or unexpected trends could render Fibonacci retracement levels less reliable.
- Self-Fulfilling Prophecy:
Because many traders use Fibonacci levels, they can become self-fulfilling prophecies. When a large number of traders act based on the same levels, it can create a situation where the price reacts as expected purely due to the collective actions of traders, rather than the level having inherent predictive power.
- Complexity and Overfitting:
More reliance on Fibonacci retracement levels alongside multiple other indicators can lead to overfitting, where the analysis becomes too complex and tailored to past data, potentially resulting in poorer predictions for future market movements.
- Market Noise:
In volatile or choppy markets, prices may not respect Fibonacci retracement levels as cleanly, leading to false signals and increased risk.
FAQs:
1. Are Fibonacci retracement levels always accurate?
Fibonacci retracement levels are not perfect, that much. They are a technical analysis tool, and although they can offer insightful information, they cannot ensure precise forecasts. Their dependability may be impacted by several factors such as market circumstances and volatility.
2. Do Fibonacci retracement levels work in all markets?
Fibonacci retracement levels have varying degrees of usefulness in various markets (stocks, currency, commodities, etc.). In choppy or extremely volatile markets, they might not be as dependable as they would be in moving markets.
3. What do Fibonacci retracement levels indicate?
Fibonacci retracement levels indicate potential areas of support or resistance where a financial asset's price might reverse or experience a pullback before continuing in the direction of the prevailing trend.
4. Which Fibonacci retracement is best?
There isn't a universally "best" Fibonacci retracement level. Traders often focus on 38.2%, 50%, and 61.8% levels as they're commonly significant, but the effectiveness can vary.
Also read:


 1,499
1,499